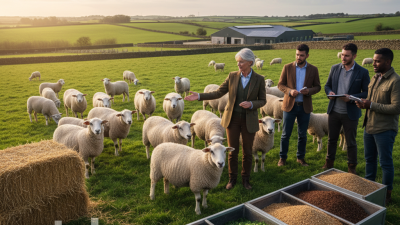
How to Improve Livestock Performance in 2026?

Improving livestock performance in 2026 will require more than faster growth or higher milk yields. It will require healthier animals, efficient resources, and decisions supported by reliable evidence. The FAO’s 2023 report, Pathways Towards Lower Emissions, estimates that livestock agrifood systems produce about 6.2 gigatonnes of carbon dioxide equivalent annually. That figure makes efficiency an environmental priority, not merely a financial goal.

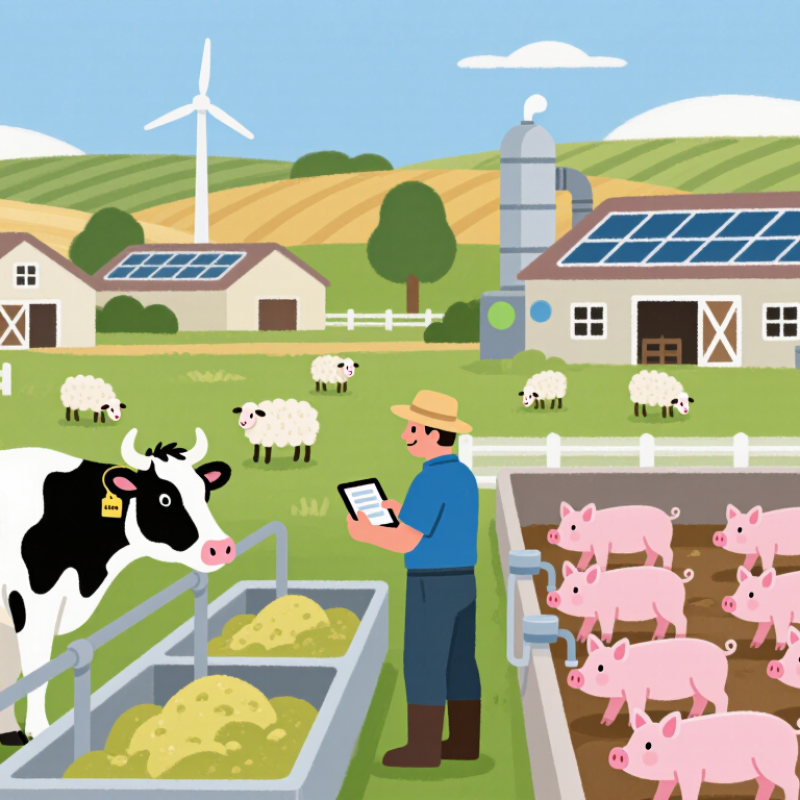
Small details often reveal larger problems. A dairy cow leaving feed in the trough may signal poor ration balance, heat stress, or declining health. A pig with uneven growth may reflect ventilation, water access, genetics, or stocking pressure. Better performance begins with routine observation, accurate records, and timely action. Feed conversion, average daily gain, fertility, mortality, vaccination status, and welfare indicators should be reviewed together. One metric can mislead.

The OECD-FAO Agricultural Outlook 2024–2033 highlights continuing growth in global demand for animal-source foods, especially in emerging markets. Meeting that demand will depend heavily on productivity gains rather than unlimited expansion. The report also stresses the importance of resilient supply chains, improved technology, and sustainable resource use. Meanwhile, the World Organisation for Animal Health emphasizes prevention, biosecurity, and responsible disease management as foundations of productive herds and flocks.

Technology can help. Sensors may identify reduced movement before visible illness appears. Precision feeding can reduce waste, although poor data still produces poor decisions. That limitation matters. Farms should test interventions carefully, compare results across seasons, and protect animal welfare throughout the process. The most reliable path to stronger livestock performance combines skilled people, sound science, practical experience, and continuous reflection.
How to Improve Livestock Performance in 2026?

Defining the Key Drivers of Livestock Performance in 2026

How to Improve Livestock Performance in 2026?

Defining the Key Drivers of Livestock Performance in 2026

Livestock performance in 2026 will depend on more than faster growth. Producers must track average daily gain, feed conversion, fertility, survival, and welfare together. The OECD-FAO Agricultural Outlook 2024-2033 projects global meat production to increase by about 14% by 2033. This growth will pressure farms to produce more with fewer resources.

Feed quality remains a major driver. Balanced amino acids, clean water, and accurate ration management can reduce waste and stabilize growth. However, feed efficiency targets should not ignore animal health. A lower feed conversion ratio means little if mortality rises. The FAO’s Pathways Towards Lower Emissions report estimates that livestock agrifood systems produced 6.2 gigatonnes of CO2 equivalent in 2015. That represented about 12% of human-caused emissions. Better genetics, manure management, and local feed planning can improve both productivity and environmental performance.

Tips: Record feed intake and weight weekly. Check ventilation before summer heat arrives. Use farm data to compare groups, not assumptions. Review health records with a qualified veterinarian or nutritionist. Small errors matter.

Technology can support decisions, but it cannot replace skilled observation. A sensor may show reduced movement, while a worker notices unusual breathing first. This matters. Some farms may overinvest in equipment before fixing poor housing, inconsistent feeding, or weak records. The best 2026 strategy may be less impressive, but more disciplined. Progress will often come from correcting one overlooked detail.
Assessing Animal Health, Genetics, and Nutritional Requirements

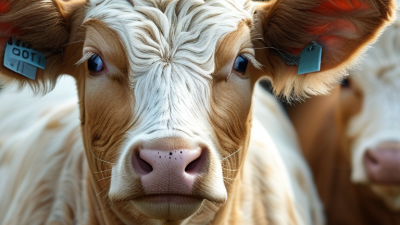
Improving livestock performance in 2026 starts with observing animals before changing their feed. A quiet calf, uneven walking, or a rough coat can signal disease, pain, or poor intake. Record body condition, weight gain, breathing, manure consistency, and daily water use. Use the same scoring method each week. Veterinary checks and laboratory testing add evidence when signs are unclear. However, visual scoring is not perfect; different workers may judge the same animal differently. That weakness deserves attention.

Genetic selection should match the farm’s climate, housing, and disease pressure. Fast growth alone can create larger maintenance needs or weaker feet. Review birth records, fertility, survival, feed efficiency, and temperament. Use several generations of reliable data, not one impressive animal. DNA tools can support decisions, but they cannot replace careful herd records. Promising genetic lines may perform poorly after moving into hotter, wetter conditions. Local adaptation matters.

Nutrition plans should reflect age, production stage, forage quality, and mineral availability. Test forage before adding supplements. A ration that looks balanced on paper may fail when animals sort feed or drink too little. Check feed refusals, chewing activity, dung texture, and body condition every few days. Adjust energy and protein gradually, especially during weaning or early lactation. Clean water must remain accessible during heat stress. Not every performance problem needs more feed. Sometimes the real issue is poor ventilation, parasites, or inconsistent handling.

How to Improve Livestock Performance in 2026? — Assessing Animal Health, Genetics, and Nutritional Requirements
Species and Production Stage Performance Dimension Key Indicator Practical Target or Reference Range Recommended Assessment Frequency Improvement Focus
Dairy cattle
Early to mid-lactation
Animal health Body condition score using a 1–5 scale Approximately 2.75–3.25 during lactation; avoid losses greater than 1 body-condition point after calving At calving, 30 days after calving, and every 30–60 days Review energy density, feed access, transition-cow management, lameness, and metabolic-disease incidence.
Dairy cattle
High-producing cows
Nutrition Dry-matter intake and dietary crude protein Dry-matter intake commonly reaches about 3–4% of body weight; crude protein is often formulated around 16–18% of diet dry matter, depending on milk yield and forage quality Feed-bunk checks daily; ration review monthly or when production changes Test forage, maintain consistent particle size, prevent sorting, and balance rumen-degradable and metabolizable protein.
Beef cattle
Growing and finishing
Genetics and growth Average daily gain and feed conversion Approximately 1.0–1.5 kg average daily gain in well-managed finishing animals; monitor feed conversion within the farm’s breed and diet system Individual or group weights every 28–42 days Use within-herd growth records, select animals with efficient growth and sound feet, and adjust energy supply to market objectives.
Beef cattle
All stages
Animal health Morbidity, mortality, respiratory disease, and treatment rate Track monthly; investigate any increasing respiratory-disease or treatment trend rather than relying only on a single benchmark Daily observation; monthly performance review Strengthen vaccination planning, quarantine procedures, ventilation, stocking density, handling, and early disease detection.
Pigs
Nursery to finishing
Genetics and growth Average daily gain and feed conversion ratio Approximately 0.70–1.00 kg average daily gain in efficient finishing systems; compare feed conversion only within similar diets, weights, and environments Weigh groups every 2–4 weeks Use breeding-value records for growth, lean yield, robustness, and litter performance; minimize temperature stress and feeder waste.
Pigs
Nursery and finishing
Nutrition Dietary crude protein and standardized ileal digestible amino acids Protein levels must decline as pigs grow; lysine-to-energy balance is more informative than crude protein alone Ration review at each phase change and after laboratory feed analysis Formulate by growth phase, test ingredients, maintain adequate water flow, and avoid excess protein that increases nitrogen excretion.
Pigs
All stages
Animal health Pre-weaning or post-weaning mortality and medication use Aim for continuous reduction; a mortality rate below 3% in a stable nursery or finishing group is a useful operational goal, but interpretation depends on system and disease pressure Record daily; review by batch and season Improve colostrum intake, hygiene, mixing practices, ventilation, stocking density, and veterinary-guided disease prevention.
Broiler chickens
Starter to market
Genetics and growth Feed conversion ratio and market body weight A feed conversion ratio of approximately 1.50–1.70 at around 2 kg live weight is achievable in well-managed flocks; results vary with sex, climate, and market age Daily mortality and feed records; weekly flock weighing Use flock uniformity data, select robust fast-growing genetics, and control temperature, lighting, litter moisture, and stocking density.
Broiler chickens
Starter and finisher
Nutrition Dietary crude protein and metabolizable energy Starter diets commonly contain about 21–23% crude protein; finisher diets commonly contain about 18–20%, with amino-acid balance and energy density carefully controlled At every feed-phase change and after raw-material changes Use digestible amino-acid formulation, protect feed quality, provide uninterrupted access to clean water, and reduce feed wastage.
Broiler chickens
All stages
Animal health Mortality, footpad condition, litter quality, and flock uniformity Keep mortality below 5% where conditions allow; maintain dry litter and high flock uniformity while monitoring welfare indicators Daily house inspection; weekly welfare review Manage ventilation and ammonia, maintain dry litter, inspect water lines, and respond rapidly to uneven growth or mobility problems.
Sheep and goats
Breeding females
Nutrition and reproduction Body condition score using a 1–5 scale Approximately 2.5–3.0 at mating and 3.0–3.5 at lambing or kidding, adjusted for breed and production system At mating, late gestation, and weaning Separate animals by condition, protect late-gestation energy intake, and provide adequate protein, minerals, and clean water.
Lambs and kids
Growing phase
Genetics and growth Average daily gain and weaning weight Approximately 200–350 g average daily gain can be achieved in well-managed growing lambs; target values for kids depend strongly on breed and diet Birth, weaning, and every 30–45 days thereafter Select for growth, survival, parasite resilience, and sound structure rather than growth rate alone.
Sheep and goats
All stages
Animal health Internal parasite burden and anemia risk Use fecal egg counts and clinical indicators; avoid routine blanket treatment without evidence of need During high-risk grazing periods and when performance declines Apply targeted selective treatment, rotate grazing when practical, monitor anemia, and maintain quarantine procedures for introduced animals.
Reference note: The ranges shown are practical industry benchmarks rather than universal pass/fail limits. Actual targets should be adjusted for breed, age, climate, housing, feed analysis, disease status, and local veterinary or nutritional guidance.

Implementing Precision Feeding and Data-Based Herd Management

How to Improve Livestock Performance in 2026?

Implementing Precision Feeding and Data-Based Herd Management

Precision feeding can improve livestock performance when decisions match each animal’s actual needs. Instead of feeding every animal identically, producers can adjust rations according to age, weight, growth rate, milk yield, and body condition. A digital scale near the handling area can provide useful weekly measurements. Feed intake records can reveal whether animals are wasting feed or losing appetite.

Data becomes valuable only when staff collect it consistently. A practical herd system may combine weighing records, health observations, feed changes, and reproductive events. Managers should check these records during a fixed weekly meeting. A sudden drop in intake may indicate heat stress, poor water access, illness, or an unbalanced ration. The numbers suggest a problem, but trained observation helps explain it.

Small changes matter.

Rations should be adjusted gradually, with close monitoring during the following days. Sudden changes can disturb digestion and make performance harder to evaluate. Sensors may also produce incomplete or inaccurate readings because of dust, damaged equipment, or poor calibration. That weakness deserves attention. Not every alert requires immediate intervention, and not every improvement comes from technology. Staff experience, veterinary guidance, laboratory feed analysis, and reliable farm records should support each decision. Reviewing errors openly can improve the next feeding cycle and protect animal welfare while controlling production costs.

How to Improve Livestock Performance in 2026?

Implementing Precision Feeding and Data-Based Herd Management

The chart presents commonly reported outcome ranges from peer-reviewed precision nutrition and data-driven herd-management studies. Precision feeding can improve feed efficiency and milk output while reducing nitrogen losses and feed costs. Actual results vary according to animal genetics, diet formulation, farm conditions, and management quality.

Improving Housing, Welfare, Biosecurity, and Environmental Conditions

How to Improve Livestock Performance in 2026?

Improving housing starts with the animal’s daily experience. Measure temperature, humidity, air speed, ammonia, injuries, and lying time. A quiet barn is not always a healthy barn. Poor ventilation can leave wet bedding, coughing animals, and reduced feed intake. The World Organisation for Animal Health recommends risk-based biosecurity plans, controlled access, cleaning, and isolation procedures. These measures should be visible on the farm floor, not only written in a manual.

Welfare also affects performance. Provide enough space for movement, dry resting areas, clean water, and reliable shade during heat events. The IPCC reports that climate change increases heat stress and disease risks in livestock systems. Simple sensors can trigger ventilation or cooling actions before animals show severe distress. However, sensors do not replace trained workers. Someone must still notice the lame cow near the back gate.

Environmental control must include emissions and waste. FAO estimated that livestock agrifood systems produced about 6.2 billion tonnes of CO2-equivalent emissions in 2015, around 12% of global human-caused emissions.

Better manure storage, improved feed efficiency, and lower water waste can reduce pressure without weakening welfare. Results will vary between farms. That is the difficult part. A useful review compares mortality, growth, medication records, air quality, and energy use every month, then changes one weak point at a time.

Measuring Results and Optimizing Livestock Performance Over Time

How to Improve Livestock Performance in 2026?

Measuring Results and Optimizing Livestock Performance Over Time

Improving livestock performance starts with consistent measurement, not assumptions. Record body weight, average daily gain, feed intake, water consumption, and mortality rates. Use the same scale, timing, and sampling method whenever possible. Small differences can reveal larger problems. A sudden drop in water intake may signal heat stress, illness, or equipment failure. Check housing conditions at the same time.

Compare results across groups, seasons, and production stages. Feed conversion can improve while weight gain remains disappointing. That result deserves investigation. Review ration quality, feeding frequency, ventilation, stocking density, and animal behavior. Veterinary observations should support the records, especially when respiratory signs or repeated illness appear. Reliable decisions require both field experience and verified data.

Our first monitoring period may expose poor habits. We once focused heavily on weight gain and overlooked uneven body condition. The numbers looked acceptable, but several animals competed poorly at feeding time. That mistake changed the review process. Now, staff inspect animals individually and record unusual behavior. Not every adjustment works. Trial changes on a limited group, define a measurement period, and compare results against a clear baseline. Keep notes on weather and handling stress. These details often explain performance changes that the main spreadsheet misses.